Quick-start guide to using JCT TrafficTools
JCT TrafficTools is a free Android phone/tablet app that can be used to assist in on-site data collection.
It currently supports the following features
- Measurement of Saturation Flows
- Measurement of Degree of Saturation
- Measurement of Underutilised Green Time
- Capture of site photographs
- Emailing of all data in both a plain XML format and MS Office XML format (Excel compatible)
Contents
|
Collecting Saturation Flow data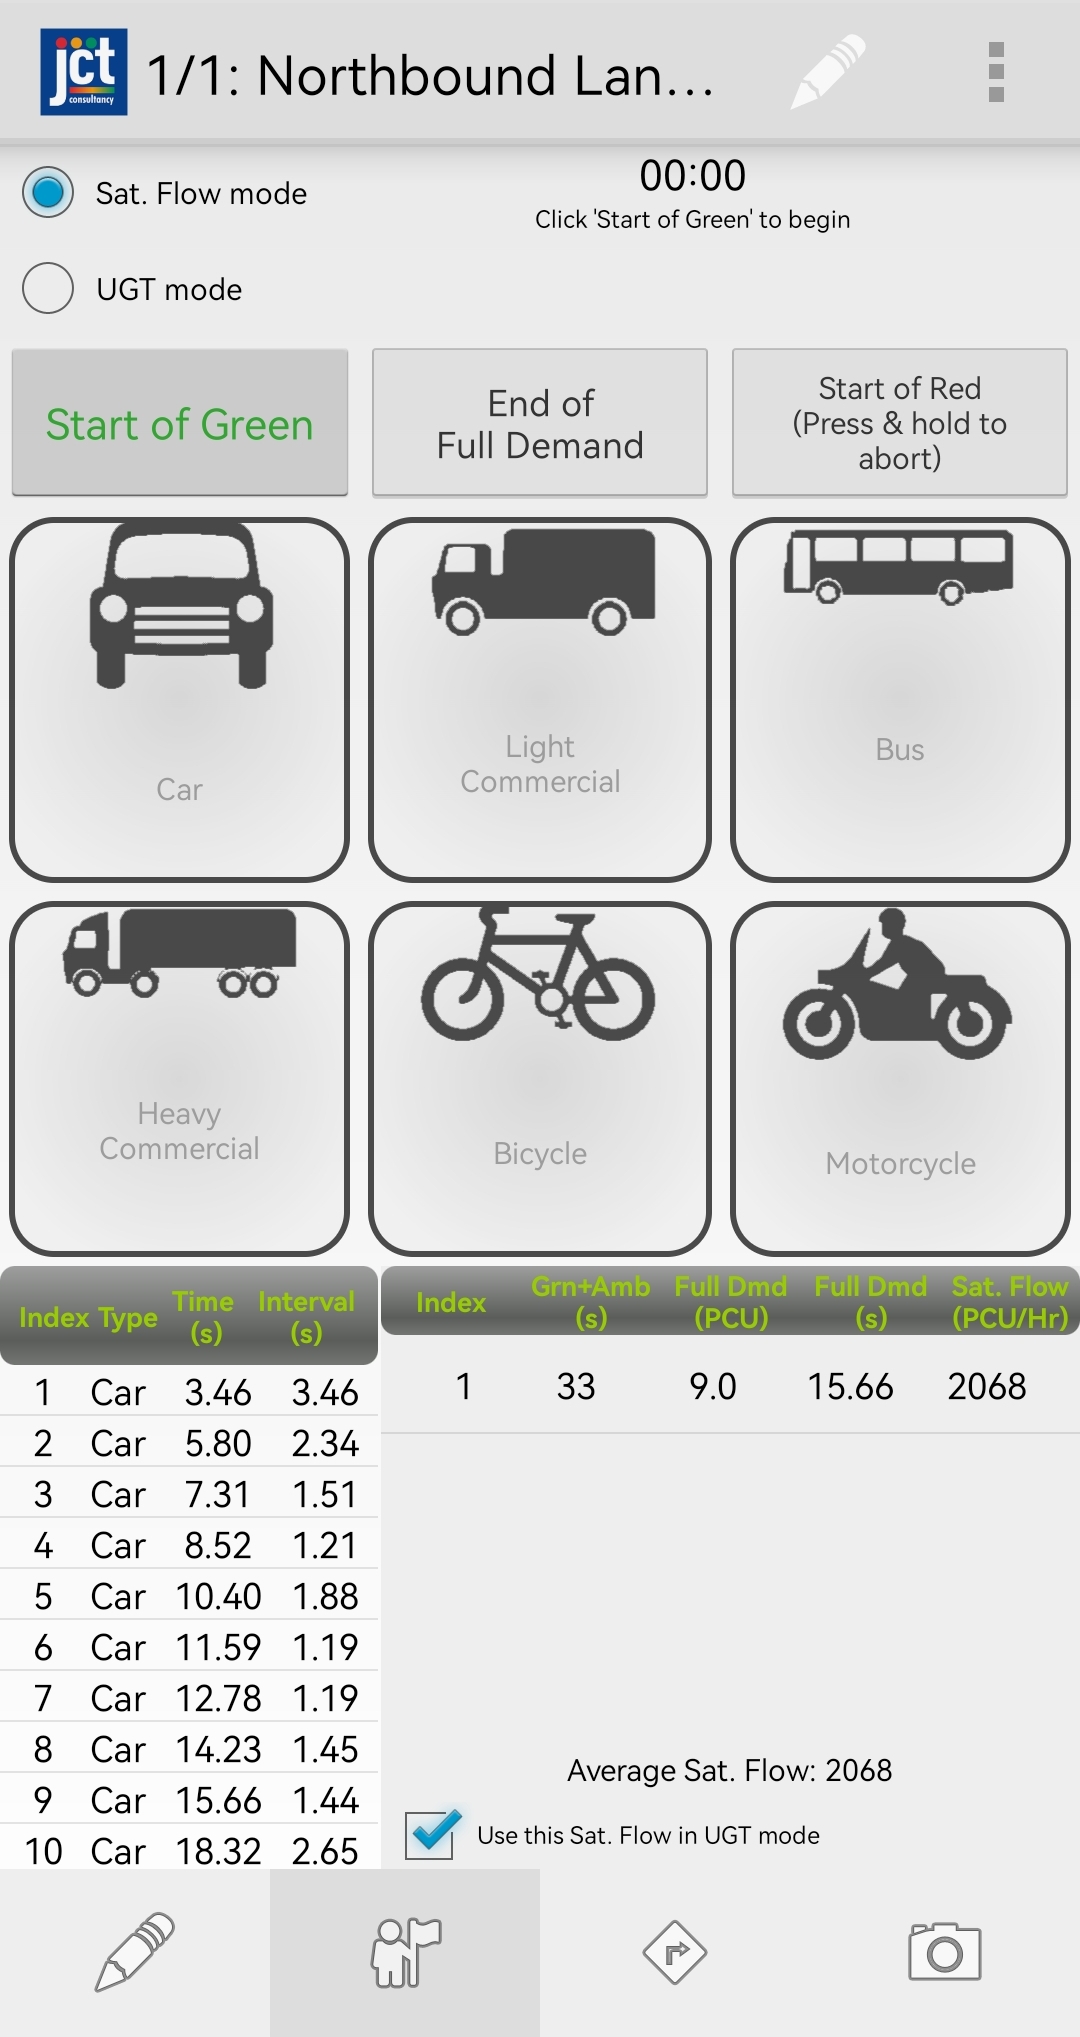
This process should be repeated to obtain as many counts as required. The average Saturation Flow over all the measured green periods is displayed at the bottom of the screen. Tips
|
Collecting data for Degree of Saturation (DoS) and Under-utilised Green Time (UGT) measurement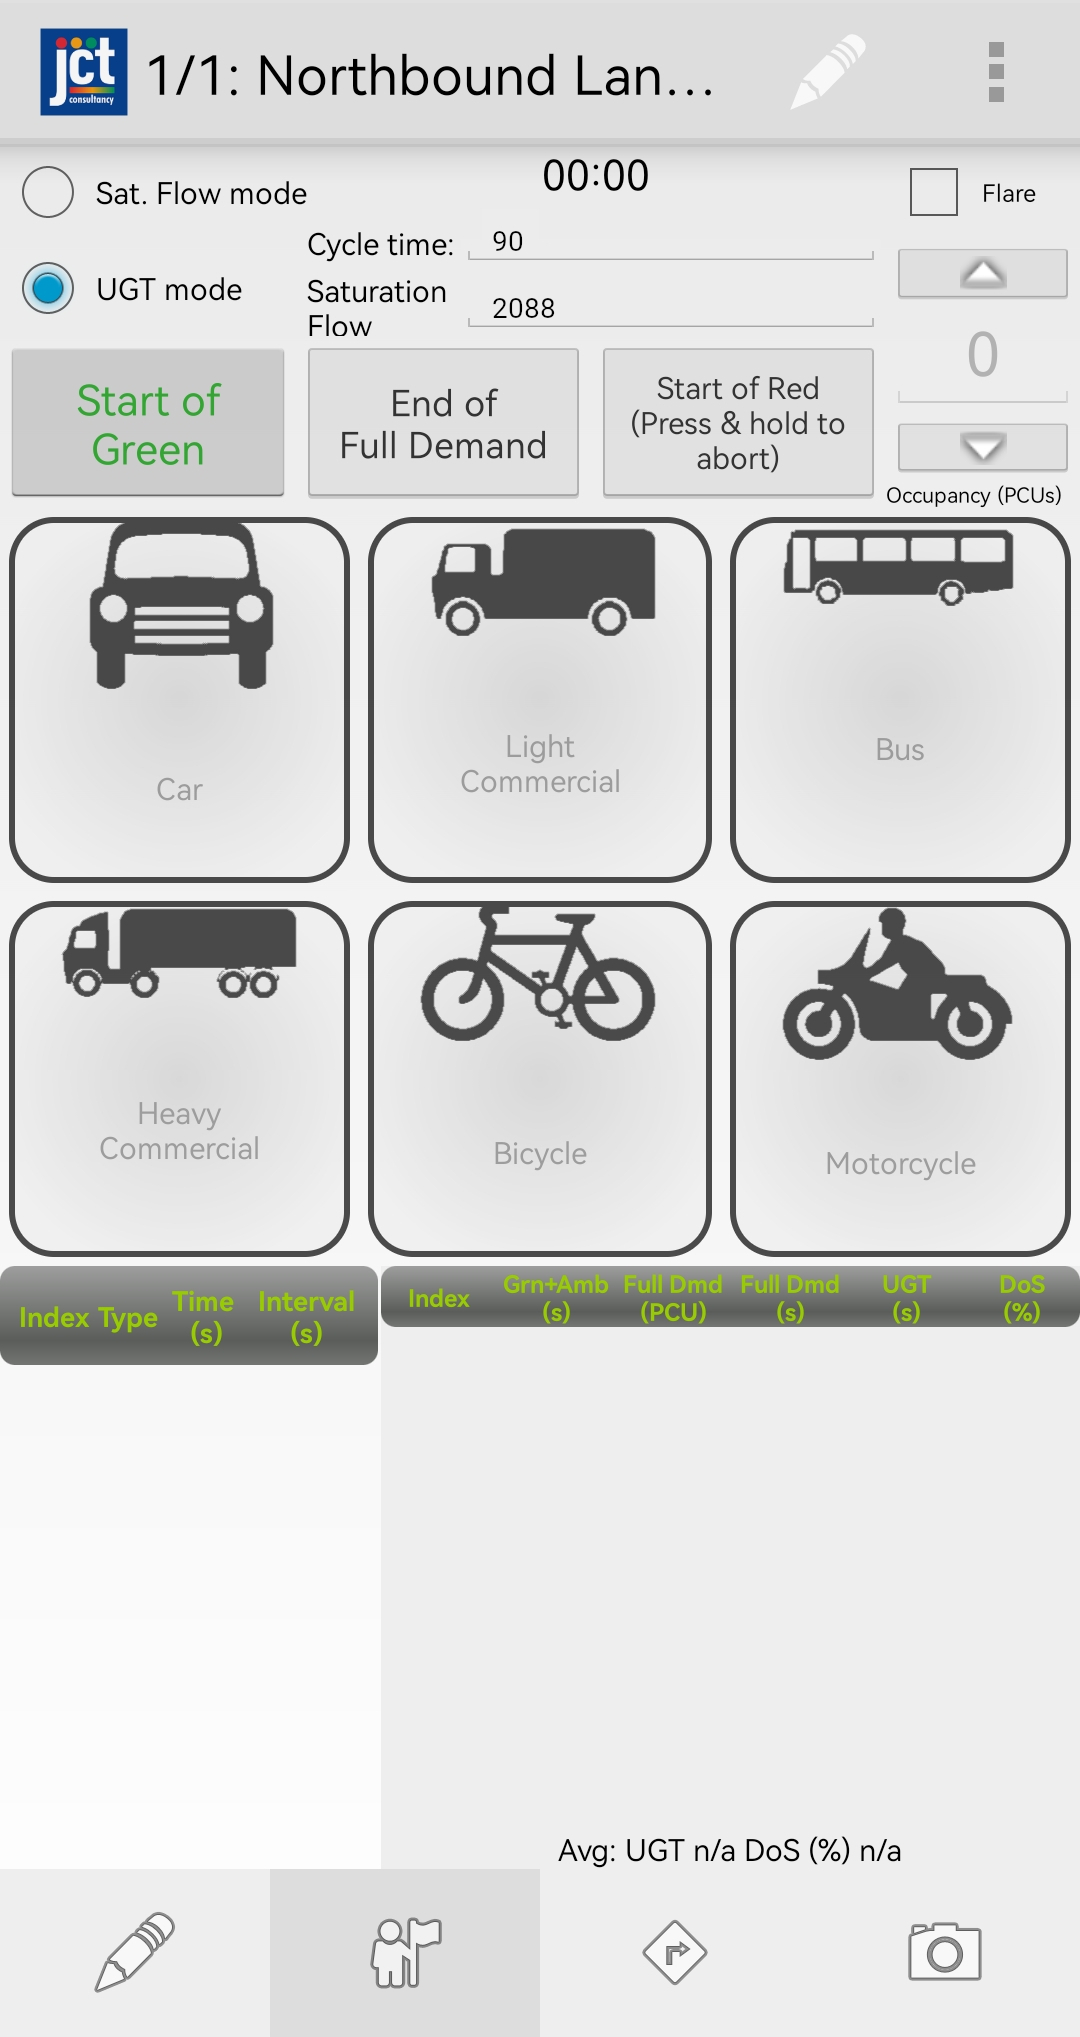
When the stop line saturation flow is known, the collection of vehicle times across the stop line allows for the calculation of Degree of Saturation and Under-utilised Green Time. Definitions and Formulae for these calculations can be found in the Appendix 1 of the Transport For London Traffic Modelling Guidelines
This process should be repeated to obtain as many counts as required. The average Saturation Flow over all the measured green periods is displayed at the bottom of the screen. Tips
|
Recording data separately for multiple arms and lanes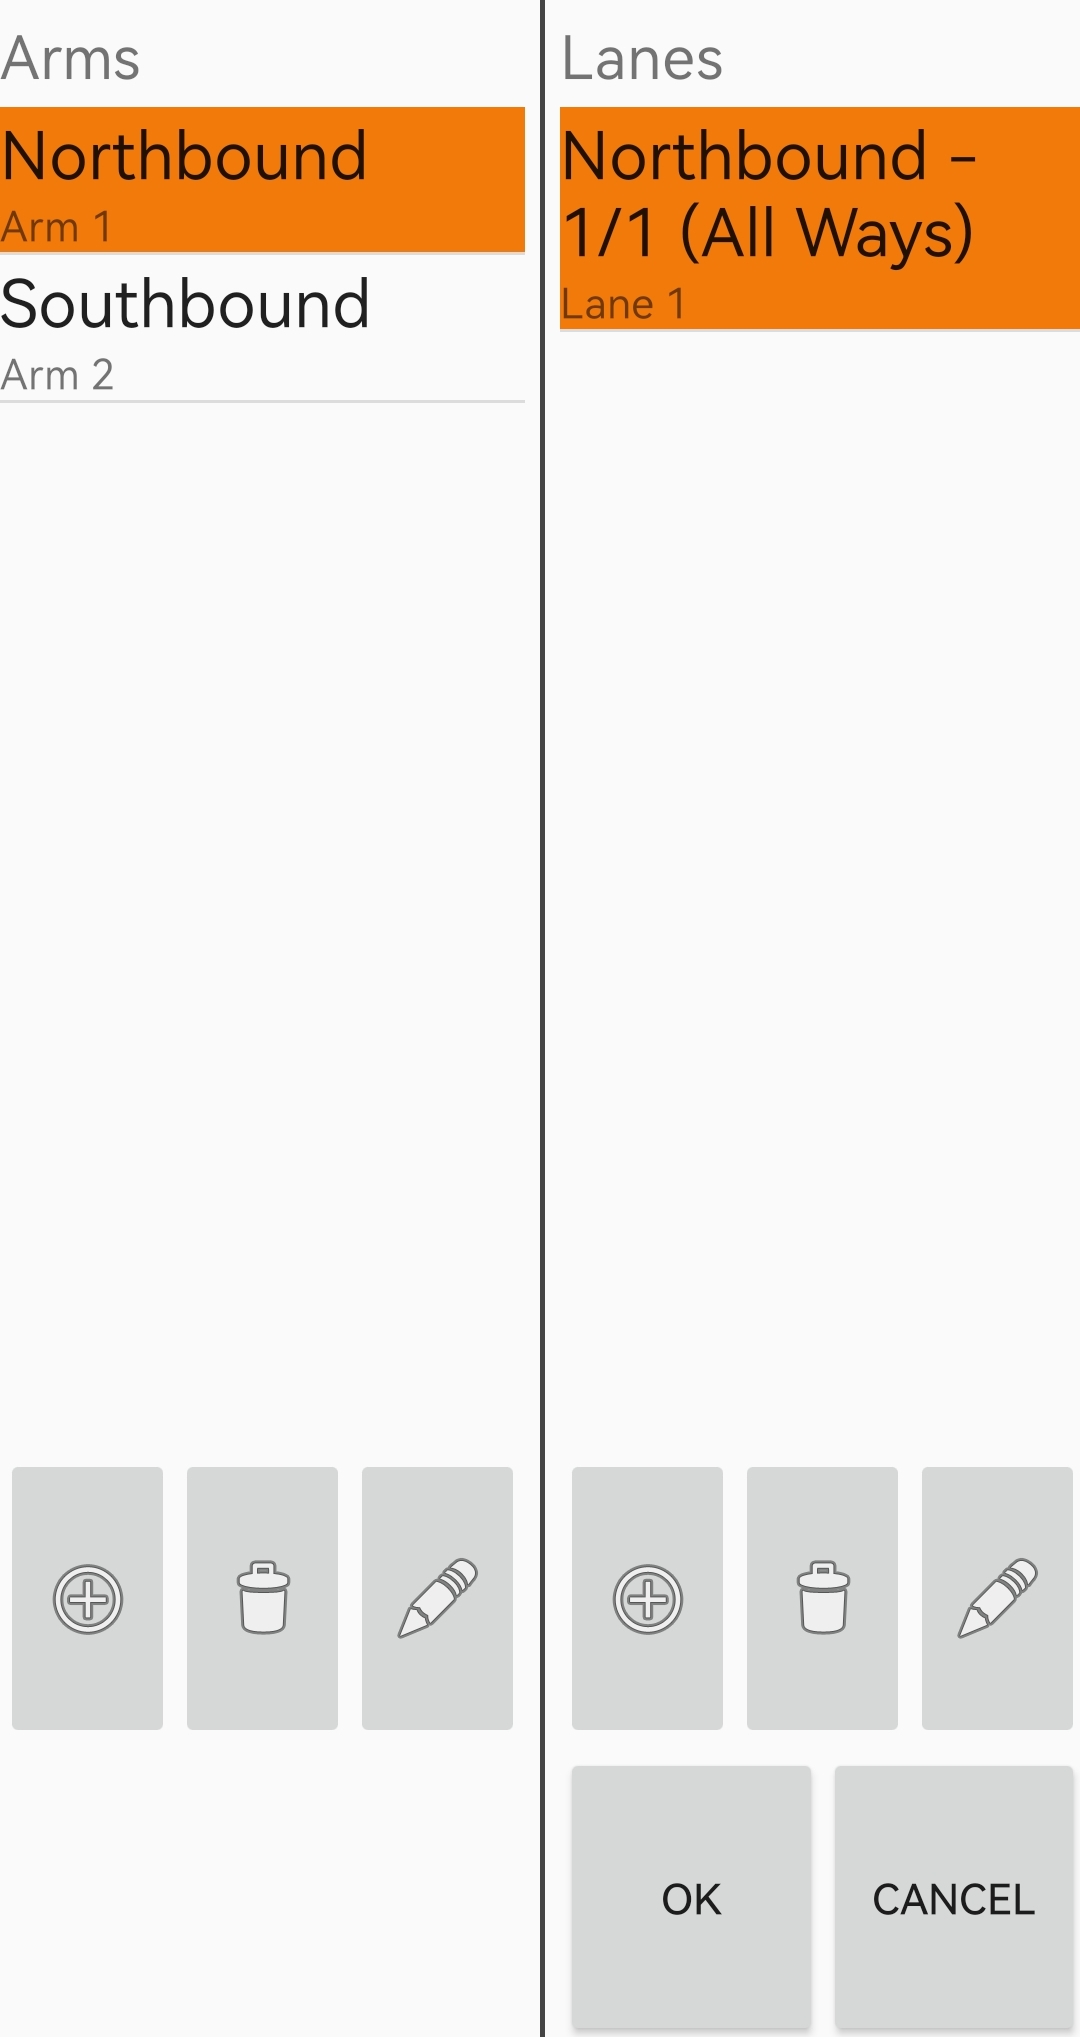
If you need to record data for more than one arm or lane, you can do so by specifying the relevant arms and lanes. Any Saturation Flow or UGT measurements taken are recorded against the currently selected lane.
Tips
|
Editing project settings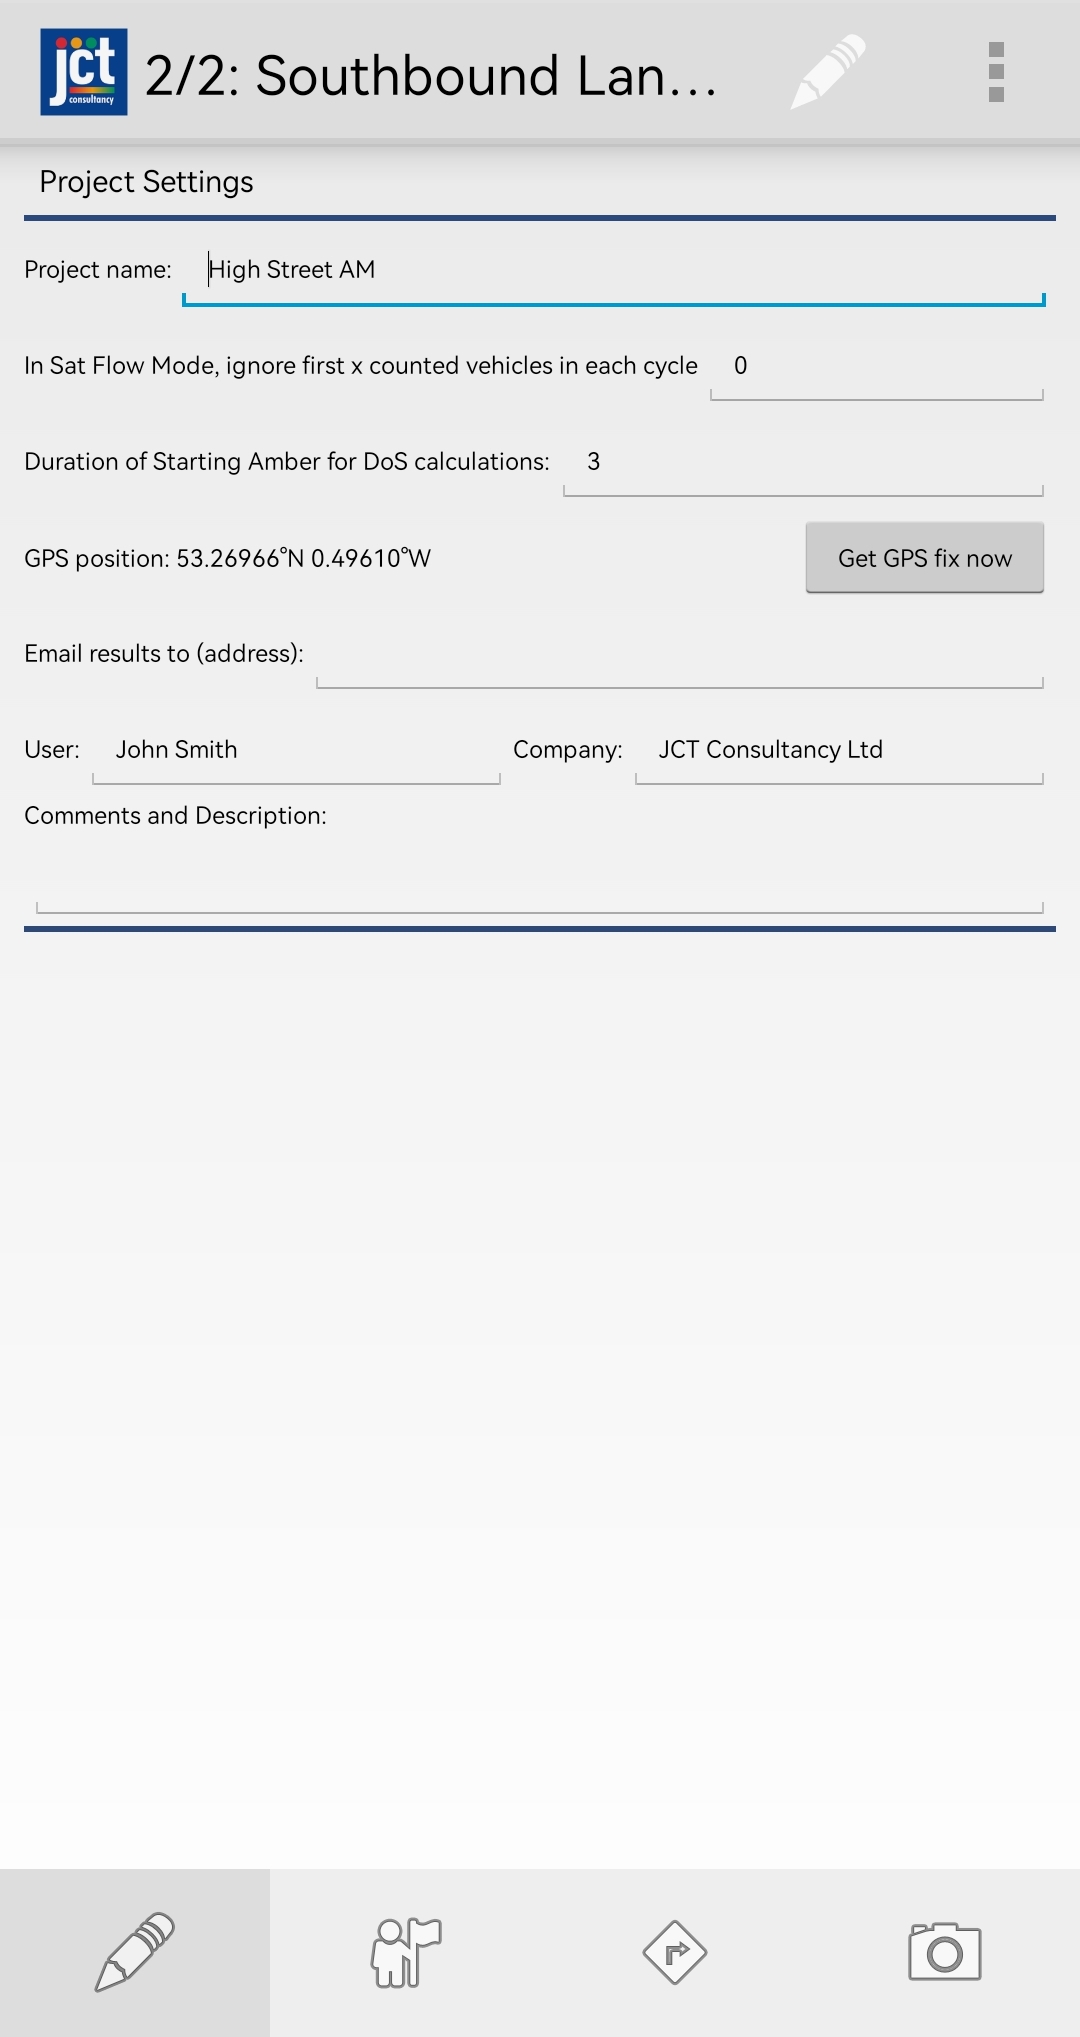
The JCT Traffic Tools app contains four separate pages that can be switched between by swiping the screen left or right, or using the navigation buttons at the bottom of the screen: 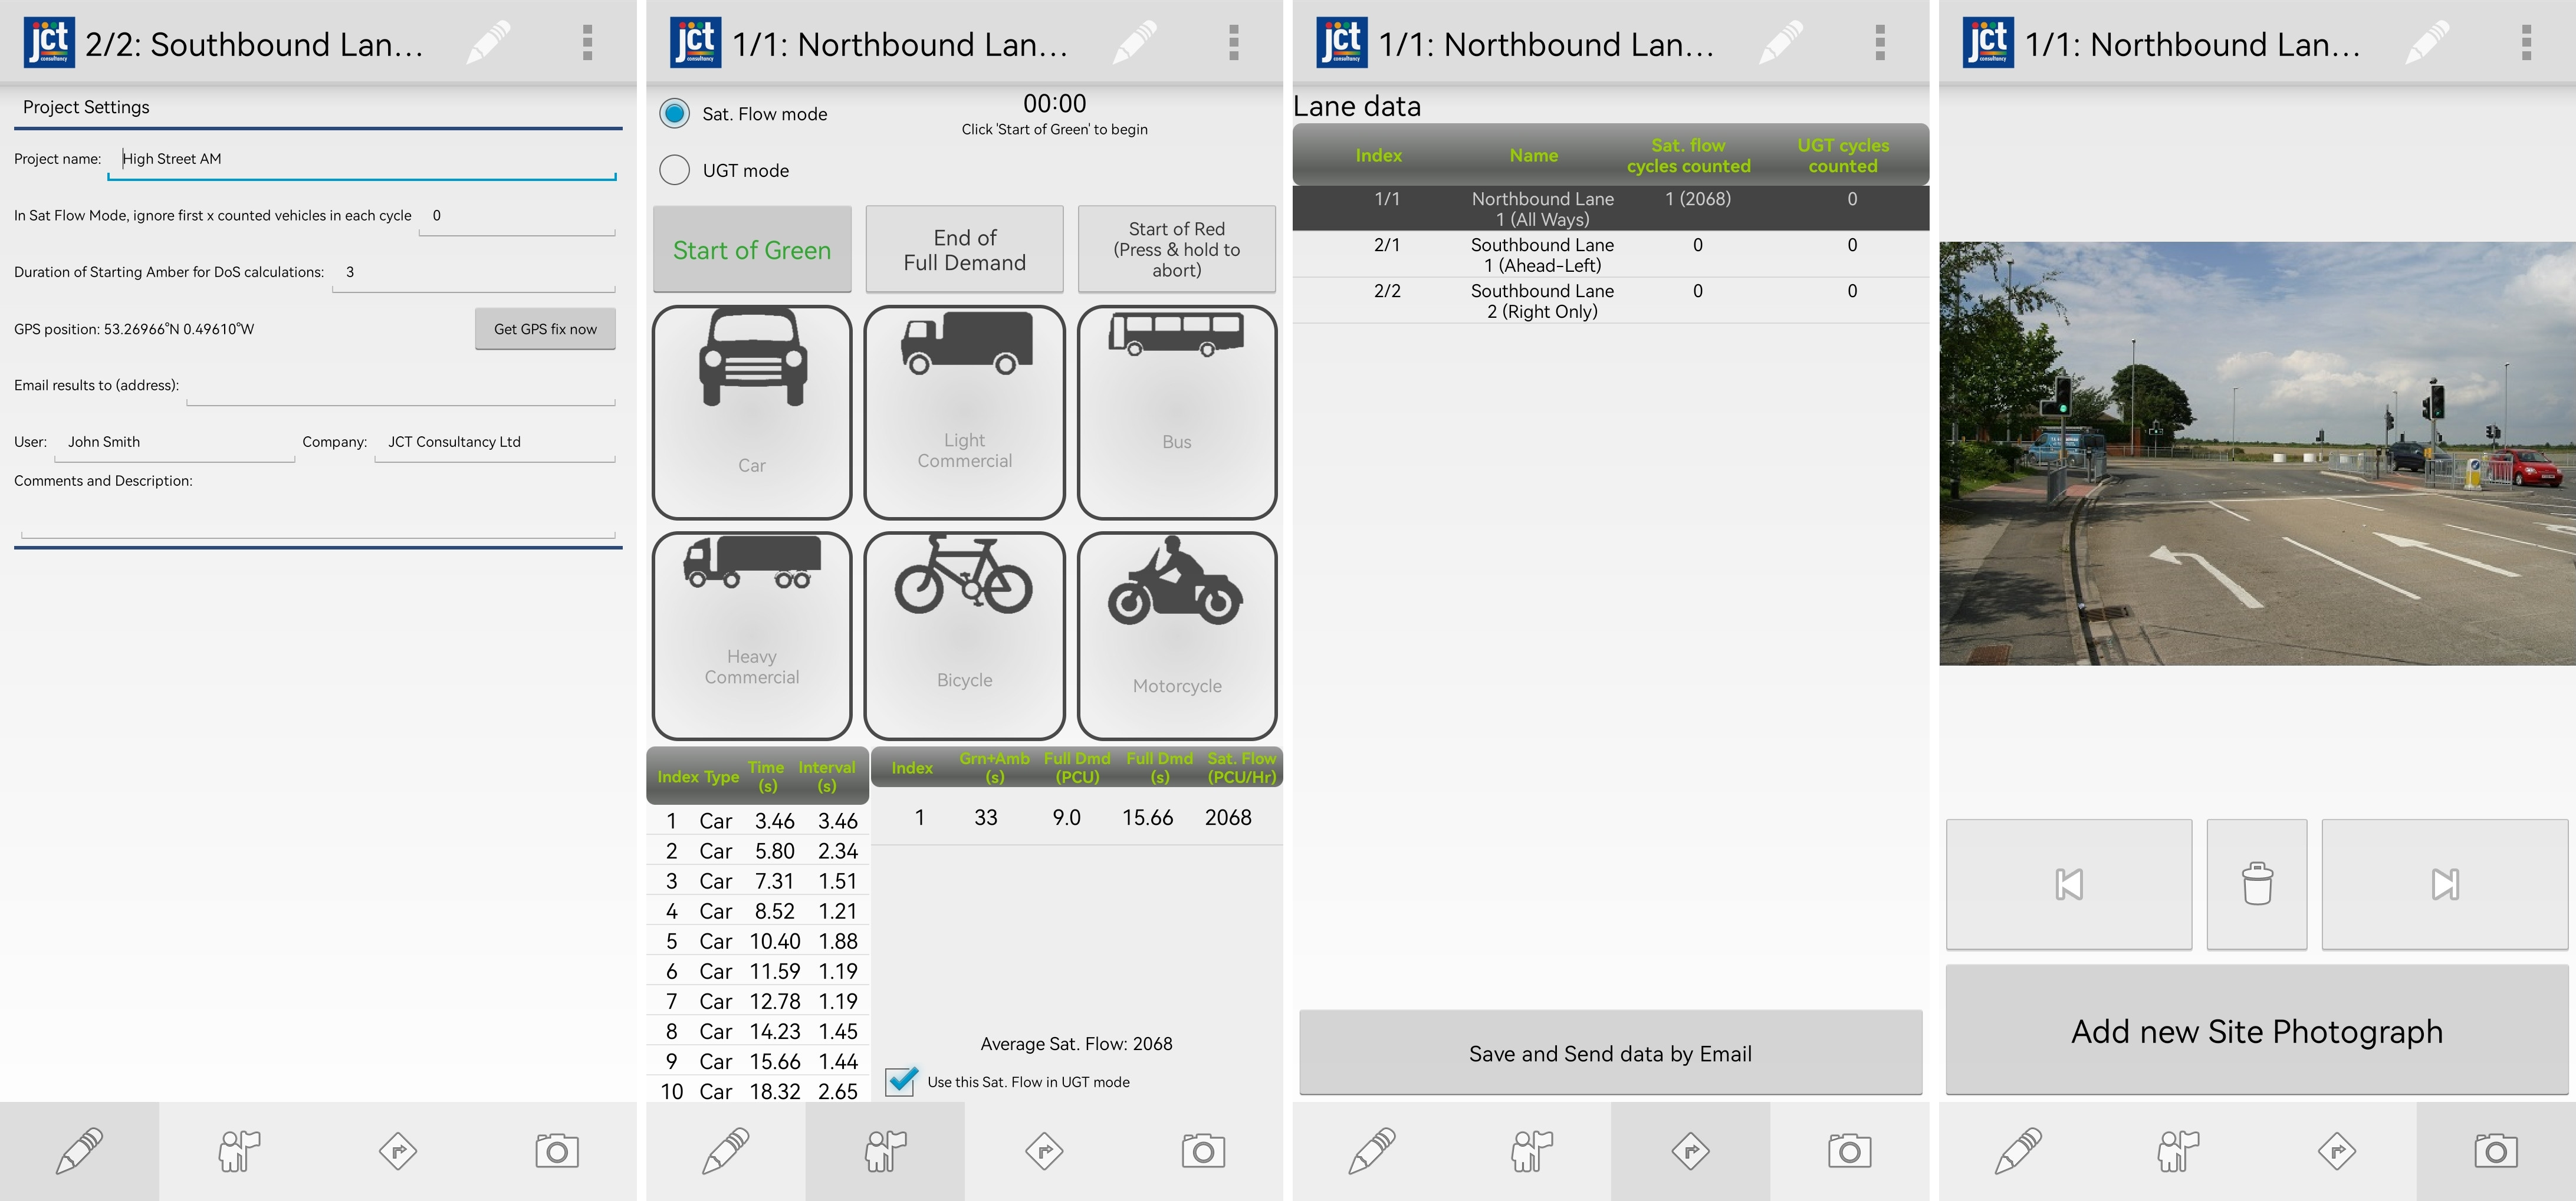
The Project Settings is the leftmost page. Here you can set the following:
|
View a summary of all lanes and send all data by email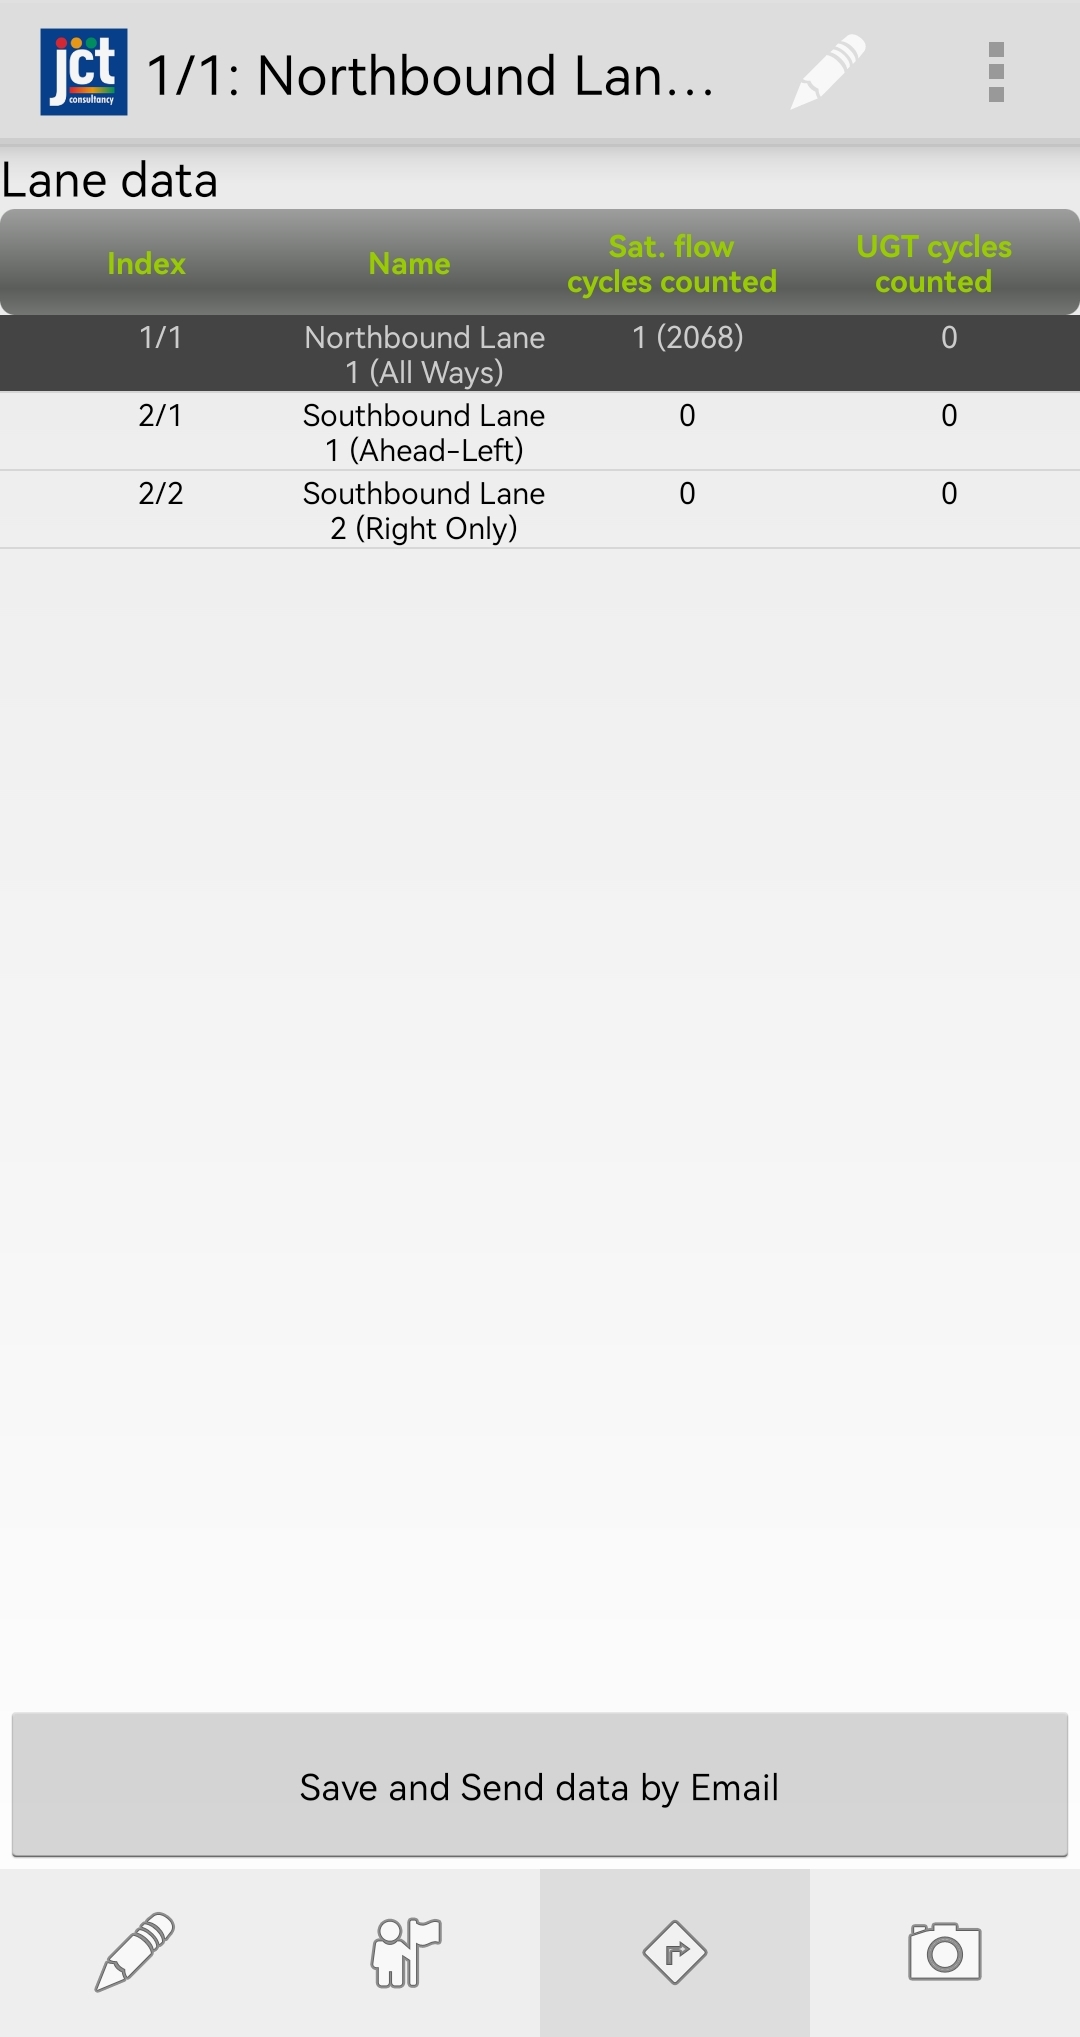
The Lane Data summary page lists all lanes along with the number of cycles that have been counted on each lane. Tap the "Save and Send data by Email" button to send all project data via email. |
Record site photographs with the project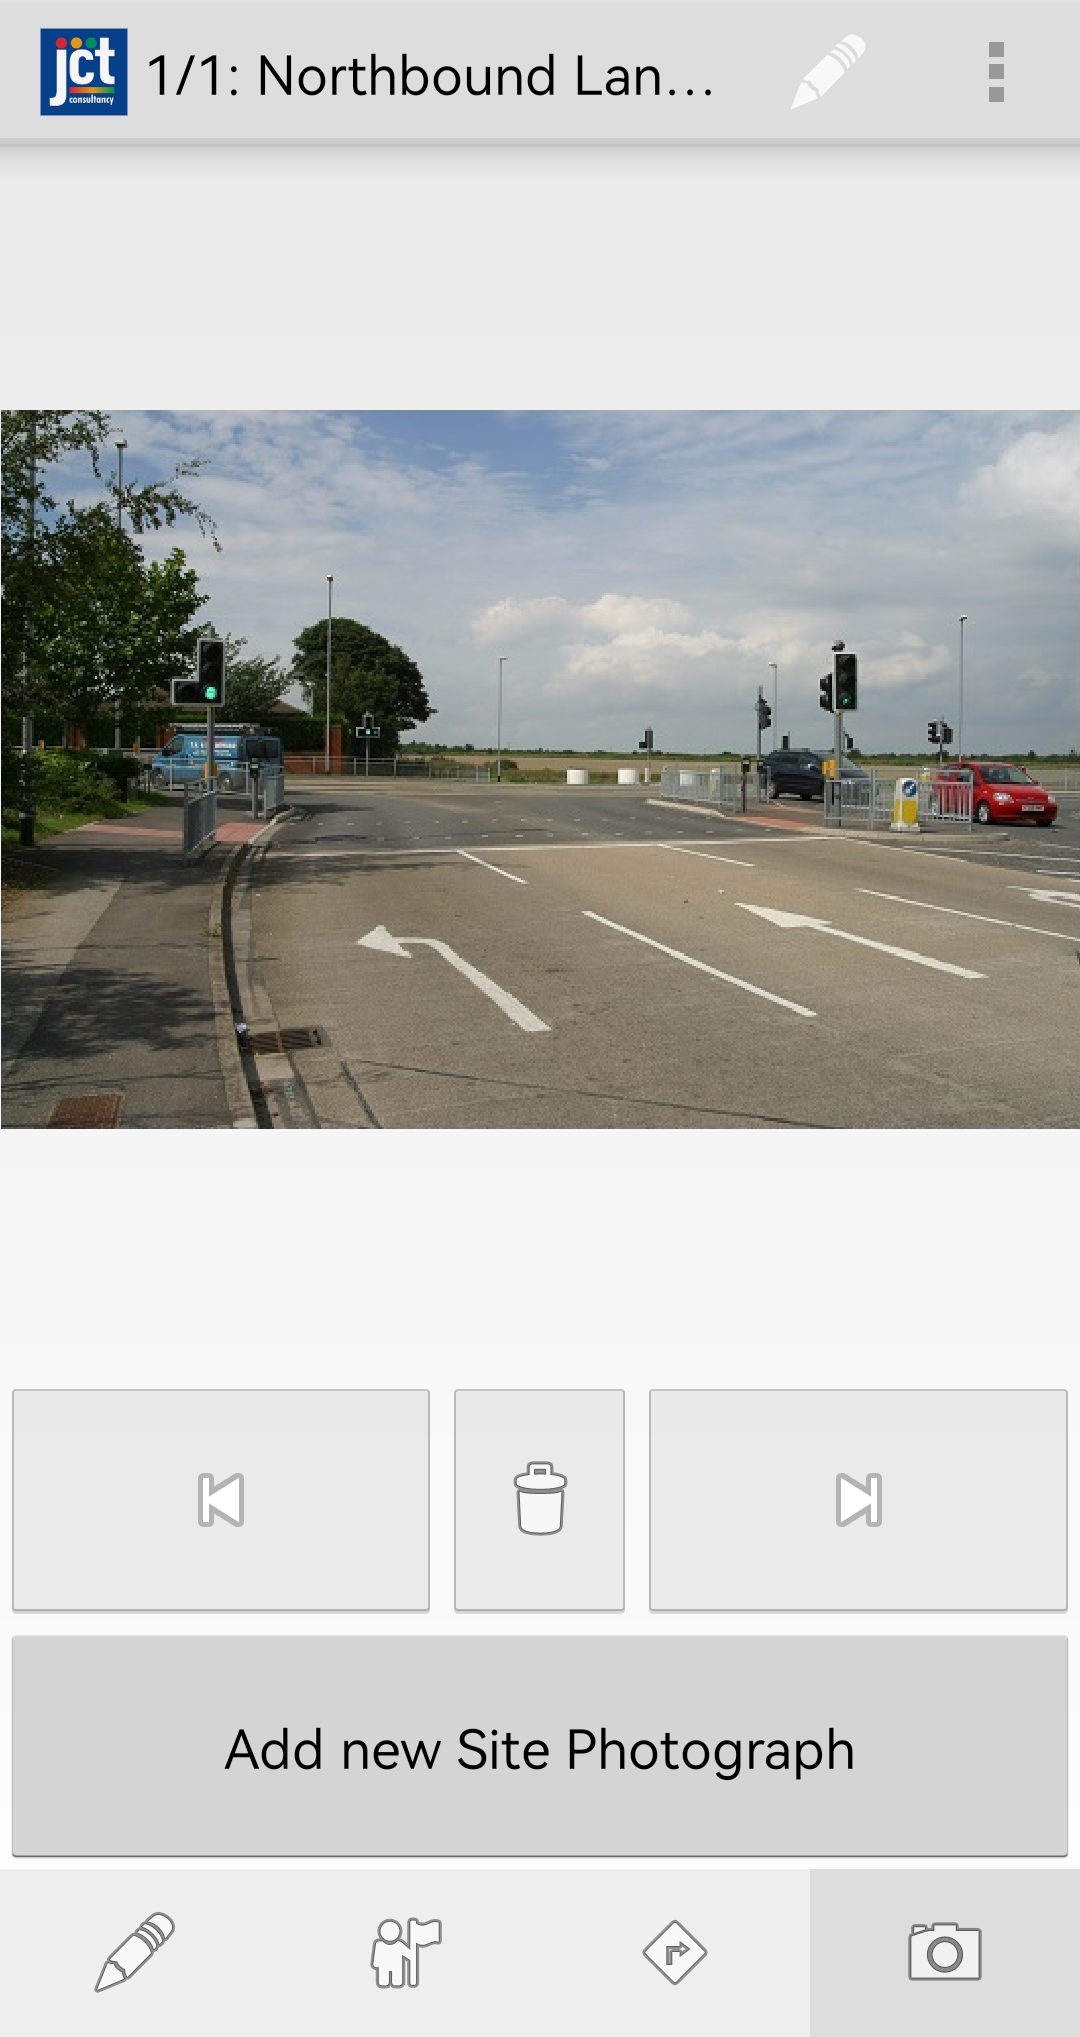
The Site Photo Gallery page is the rightmost page and allows you to collect images of the site for future reference.
|
Save and load project dataSaving and loading the project is found under the overflow menu in the top-right corner of the screen.
|
Email your project dataTap the Save and Email button under the overflow menu in the top-right corner to email your project data. You can also email your project data from the Lane Data Summary page
The email will be sent with several attachments as follows:
|
Edit application preferences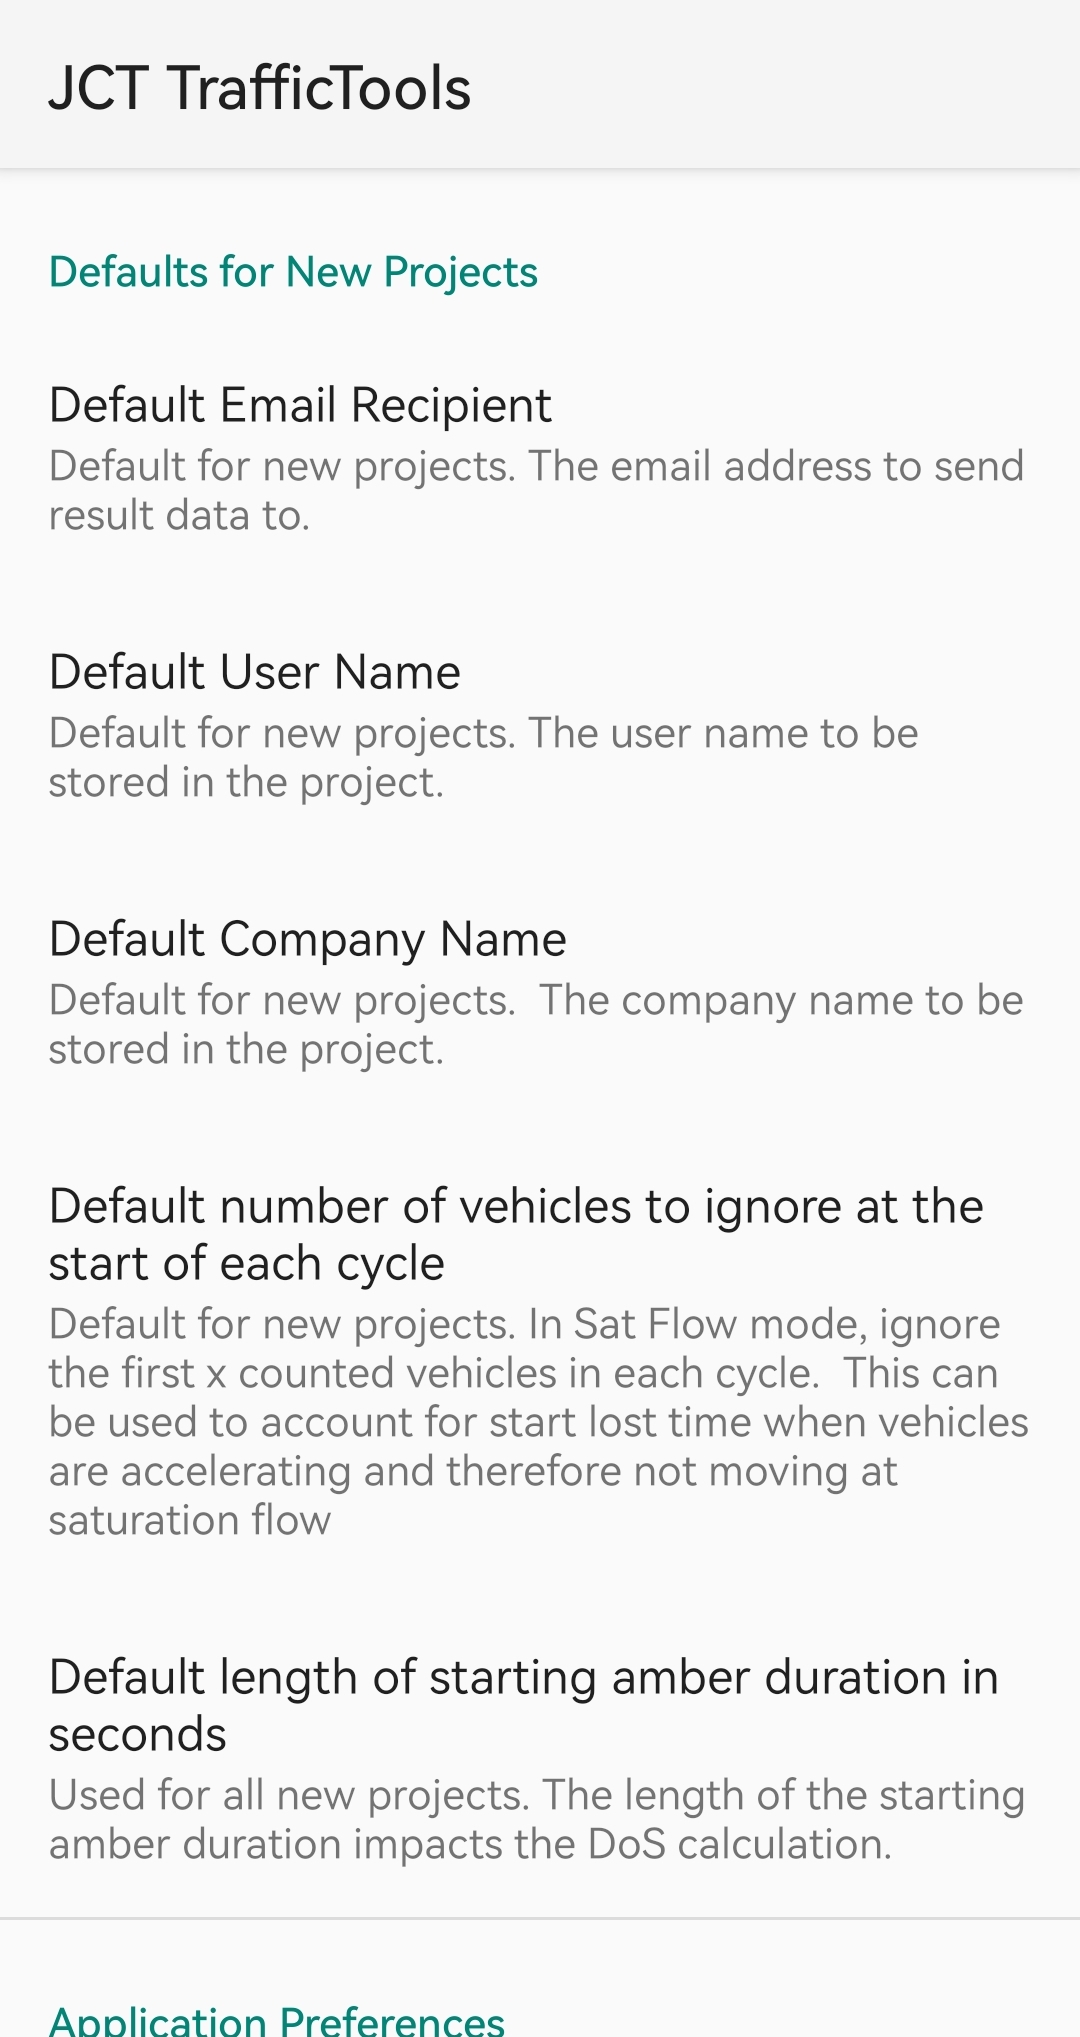
Tap the Options setting in the overflow menu in the top-right corner to access the application preferences.
|
 |
|
 |
|
 |
|

Upcoming courses
29 Sep 2026: Online Introduction To Traffic Signals ...more
13 Oct 2026: LinSig3 : Online Junction Modelling Computer Workshop ...more
20 Oct 2026: LinSig3 : Online Networks and Advanced Features Computer Workshop ...more
10 Nov 2026: Traffic Signal Design ...more
05 Jan 2027: Online Introduction To Traffic Signals ...more
Subscribe to email updates
To subscribe to Course, Software or Symposium update emails, please click here