LinSig Version 3.3
Detailed features & capabilities
Although LinSig started life as a design and modelling tool for individual traffic signal junctions it has been extended and improved many times to now be a fully fledged modelling tool for networks of signals as well as retaining the ability to model single junctions.
A central idea behind LinSig is that it models traffic signal junctions in a similar way to how a real traffic signal controller actually works. This means that LinSig takes account of the features and constraints of the controlling equipment, thereby ensuring that all modelling accurately reflects how existing junctions work, and how any design proposals would operate if implemented.
LinSig 3.3 key features
LinSig provides many modelling features the most important ones being:
- Controller Model. A sophisticated Controller Model based on the UK TOPAS 2500 specification capable of modelling multiple stage streams. LinSig 3 can model multiple controllers within a Network which can be coordinated or have different cycle times.
- Detailed Traffic Model. A traffic model which models the detailed behaviour of traffic on each lane providing predictions of capacity, delay and queuing. LinSig 3 includes a radically improved more flexible model than previous versions and removes the requirement to group lanes into links allowing independent control of short lanes and automatic modelling of short lane blocking.
- Network Capable Traffic Model. LinSig's traffic model can model both single junctions and networks. When used to model a network coordination between junctions is modelled in detail. LinSig will typically model networks of up to 10-15 junctions using a highly detailed matrix based approach and upto 20-25 junctions using a lane based flows approach.
- Multiple Flow Entry Options LinSig provides two alternative methods of entering traffic flows. The more detailed matrix based method allows flows to be defined as a network wide origin-destination matrix with the ability to model rerouting due to changes in delays in the network and highly detailed modelling of traffic signal coordination. Lane based flows provides a simpler option which allows flows to be entered lane by lane without the requirement for an OD matrix but is potentially less accurate and cannot model routing effects.
- Graphical Traffic Count Management LinSig uses traffic turning counts to estimate a network origin-destination matrix. Turning counts can managed graphically which allows poor quality counts or consistency errors to be quickly located and rectified.
- Right Turn Model. LinSig includes a particularly sophisticated right turn model which allows the operation of right turns, whether opposed, unopposed or a combination, to be modelled in considerable detail. Right turn capacity is often a crucial determinant of overall junction capacity and it is important to correctly model all of the subtle aspects of a right turn.
- Bus Modelling Separate modelling of bus traffic allows signal timings to be optimised taking into account custom bus cruise and stopping times. Separate delay and journey time outputs are available for buses.
- Model Auditing. LinSig includes a model audit view which as well as allowing key model information to be viewed in a common format in one place allows different LinSig scenarios or files to be compared and differences highlighted.
- TRANSYT Compatibility. Except when LinSig's more sophisticated modelling options are used, LinSig can produce numerically equivalent results to TRANSYT PDM models for the same signal times. This allows comparison and validation against existing modelling work before optionally going on to use LinSig's advanced features to improve the model.
- Pedestrian Modelling. LinSig can optionally model pedestrian delays and linking through each junction. LinSig also models control related pedestrian issues in its controller model.
- Signal Optimiser. A Signal Optimiser which optimises traffic signal stage/phase durations taking into account constraints of the control mechanism. The optimiser can optimise junctions individually or over the whole network.
- Equilibrium Assignment of OD Matrix. Traffic Flow data can be defined using an Origin-Destination matrix and assigned automatically to Routes through the junction or network. LinSig 3 includes a sophisticated assignment method based on user equilibrium assignment as used in larger strategic transportation models.
- Matrix Estimation. Where no Origin-Destination matrix exists for a network LinSig can estimate a 'best fit' matrix from traffic turning counts. This allows more sophisticated matrix based modelling methods to be used even where it is not feasible to directly count the OD matrix.
- Merging of Networks. Individual junction models, whether built in LinSig 3 or previous versions, can be joined together to form larger networks.
- SCATS™-based controller model Controller data can be specified in a form consistent with SCATS™ controllers. Phase timings can be entered via minimum green, early cut-off green and yellow plus all-red durations, and the behaviour of Signal Groups in between successive Phases can be defined using the Phase Overlaps view. Timings of pedestrian Signal Groups are specified via walk time and clearance durations, and traffic Signal Groups can be configured to run with pedestrian protection.
- Additional features for users in Australia and New Zealand As well as the SCATS™-based controller model, traffic flows can be imported from detector data output by the SCATS™ Traffic Reported program, two-lane flared right-turns can be modelled, and junction and network performance can be indicated as a Level of Service value.
- TranEd 2 Import TRANSYT models prepared using TranEd 2 can be imported into LinSig and in most cases will run and give results immediately after importing with no further work.
- Bonus Greens Bonus Greens can be used to calibrate models to a wide range of conditions such as under utilised green time, demand dependancy, blocking back and partially protected pedestrians outside the UK.
- Batch Optimisation of Multiple Scenarios. Multiple modelling scenarios can be defined by associating traffic flow groups and signal sequences. These can then be calculated or optimised in batches allowing rapid recalculation of results after making changes to the model.
- Stage Sequence Library. Each junction can have a library of stage sequences defined which can be easily reused at any point. With LinSig 3 Stage Sequences can be further combined into Network Control Plans which specify the signal control for an entire network.
- Phase Based Design. Unique graphical Phase Based Design Editor which allows signal sequences to be designed based on Phases alone. This process can often allow a more efficient stage sequence to be designed. LinSig's Phase based Design tool assists with the design process whilst requiring enough input from the engineer to ensure a sound practical stage sequence.
- Multiple Flow Groups. Multiple flow groups can be defined for different time periods or development scenarios. Component flow groups can be combined using flow group formulae allowing flexible calculation of future or proposed traffic flows.
- Cycle Time Optimisation. A range of cycle times can be graphically analysed and the optimum selected.
- Interstage Optimisation. Interstage optimisation can be carried out either interactively using the Interstage View or by using LinSig's interstage optimiser.
- SCOOT/UTC Calculator. A SCOOT Database Configuration Calculator to assist with the preparation of data for SCOOT or UTC databases.
- Report Generator. A Report Generator which produces detailed customisable reports, including graphics and tables, in RTF format which is compatible with MS Word and most other word processors.
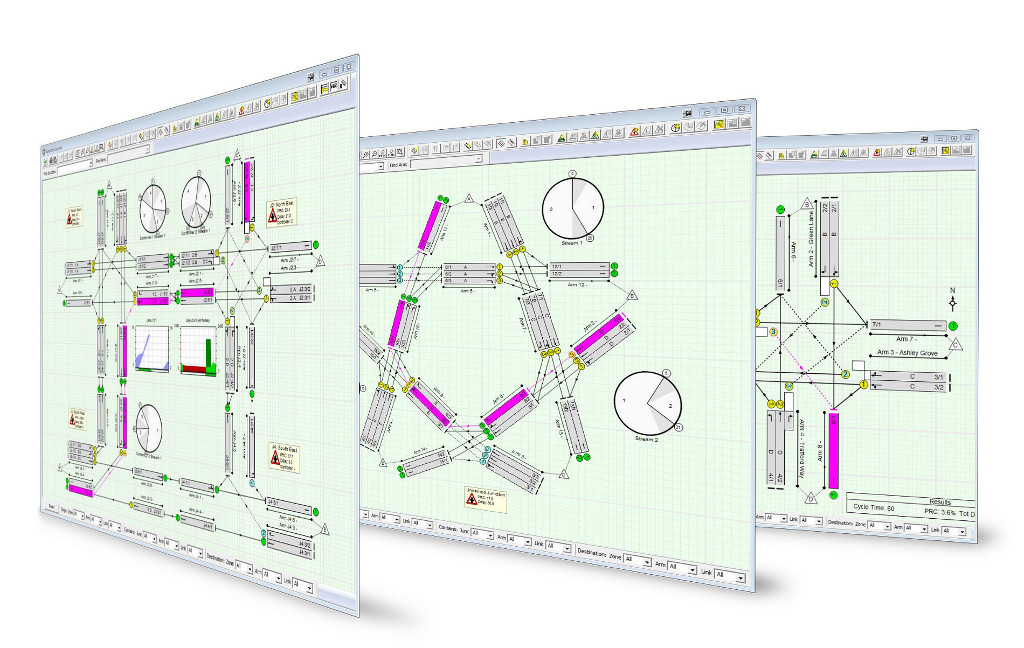
- Link Bandwidth Display. The Junction Layout View can display traffic flows as bandwidths providing a clear summary of where how traffic is passing through the network.
- Network Animation. Animation of Signal Timings and Queues. Signal Timings and queues can be animated on the Junction Layout View, Phase View and Signal Timings View.
- Export to CAD. Graphics can be exported to DXF for import into AutoCAD and other CAD software.
- View Manager. Arrangements of LinSig Views can be saved allowing screen layouts to be easily changed.
- Embedded Notes on the Network Diagram. Networks can be annotated using 'Post-It' notes embedded in the Network Diagram.
- Timing Dials. Timing Dials provide an easy way of adjusting signal timings directly from the Junction Layout View and are very useful for the interactive optimisation of signalled roundabouts for maximum entry capacity.
Further information on LinSig
We aim to provide all the information you need to fully evaluate LinSig before deciding whether to purchase. Some aspects you may need more information on include:
- Download a trial copy of LinSig →
- Get more information on software support →
- Get more information on training →
- Get more information on prices and how to order →
- Get more information on hardware & software requirements →
 |
|
 |
|
 |
|

Upcoming courses
20 Oct 2026: LinSig3 : Online Networks and Advanced Features Computer Workshop ...more
10 Nov 2026: Traffic Signal Design ...more
05 Jan 2027: Online Introduction To Traffic Signals ...more
19 Jan 2027: LinSig3 : Online Junction Modelling Computer Workshop ...more
Subscribe to email updates
To subscribe to Course, Software or Symposium update emails, please click here