TranEd Version 2
Detailed Features & capabilities
TranEd's features include:
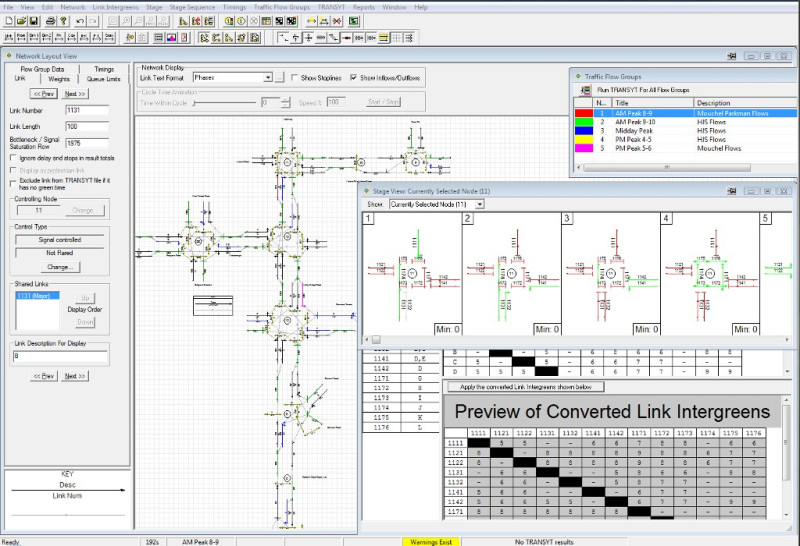
- A Network Diagram showing the layout of nodes and links in the TRANSYT model.
- Allows new networks to built from scratch or imported from existing TRANSYT files.
- Checks existing files for errors and constantly checks new data as you work highlighting errors as they occur and directing you to their source.
- User friendly editing facilities allows data to be modified and viewed in easy to understand dialog boxes and graphical displays.
- A signal information editing system which lets you enter signal data in a sensible modern-signals aware manner and then transparently converts this into TRANSYT's more old fashioned way of defining signal data.
- The use of "link intergreens" to allow TranEd to recalculate and recheck interstage structures as stage sequences are changed.
- The ability to define stages graphically by selecting the links running in each stage (similar to the LinSig Stage View but for links not phases).
- The ability to construct and easily change multiple stage sequences by drag and drop (similar to constructing a stage sequence in LinSig).
- Flexible graphical reporting of information by allowing custom link data sets to be defined.
- New data displays showing queue lengths and traffic flow bandwidths.
- A completely new Report Generator which produces reports in Rich Text Format (rtf), a format used by all common word processors such as MS Word and Wordperfect. Multiple report formats and templates can be defined and can include embedded graphics (e.g. stage sequences). The report generator will also appear in LINSIG as well in due course.
- Network annotation. This will allow editable text to be placed on the network diagram.
- Support for plotting networks on large format (eg A0) plotters.
- Cycle time analysis. Basically a graphical version of CYOP and similar to the LINSIG cycletime optimisation view.
- A new card view that will allow the underlying TRANSYT cards to be viewed in a grid type view. These will update dynamically as the network is being edited and will also be partially editable allowing easy bulk changes to data for those who understand TRANSYT cards.
- A signals animation view that shows each link as red or green as the signal sequence is animated.
- Time-Distance diagrams showing the movement of traffic through successive links
- Support for multiple traffic flow groups to allow for example the AM + PM Peaks to be defined in the same file and easily switched between.
- Graphical depictions of the TRANSYT graphs.
Further information on TranEd:
- Get general information on TranEd →
- Download a free Demonstration copy of TranEd →
- Get more information on technical requirements for TranEd →
- Get more Information on Training →
- Get more information on prices & how to order →
|
Home |
Software |
LinSig V3 |
quickGreen 2 |
TranEd |
Detailed Features |
Free Demonstration |
Buying TranEd |
Technical Requirements |
TranEd Reader |
FlowRound |
LinSat |
JCT TrafficTools |
Training |
Consultancy |
Software Support |
Symposium |
|
 |
|
 |
|
 |
|

|
|
|
Upcoming courses
25 Nov 2025: Traffic Signal Design ...more
20 Jan 2026: Online Introduction To Traffic Signals ...more
03 Feb 2026: LinSig3 : Online Junction Modelling Computer Workshop ...more
Subscribe to email updates
To subscribe to Course, Software or Symposium update emails, please click here